














0:43
Lead & lag measures
Start with the lag measure and work backwards
The number you already report every month is the lag measure. Work back from it and you find the two or three activities that actually drive it. Those are your lead measures.

Vlog
Fifty-nine clips, 44 minutes all in, on lead measures, scoreboards and why nobody opens the Monday pack. Seven are outtakes, offcuts or silent b-roll, and three still have a Like it arrow burned into the picture because they were filmed for a social feed. The whole library, not a tidy six.
All 59 videos
Two clips, 1 minute 49 between them: what a lead measure actually is, and why a report is only ever as good as the data going into it. Get those two straight and the other 57 make sense.
Lead & lag measures
The number you already report every month is the lag measure. Work back from it and you find the two or three activities that actually drive it. Those are your lead measures.
Data & systems
A conversation on a park bench about where to start. Do not swap out the ERP because the customer bit of it is painful; put a proper CRM alongside it and wire the two together. Your report is only ever as good as the data going in.
Lag is the number in your board pack. Lead is the two or three things somebody can actually do on Tuesday morning to move it. Eight clips on finding yours, and one of them is about a toaster.
Your two or three lag measures are already in the systems you run, and they are the easy half. The lead measures are the activities that drive them: training sessions with your engineers, what is on the van, the questions asked before the visit. Finding yours is the work.
They knew customers waited too long on the phone, and nobody had a number for it. Wait time is the lag measure; calls answered per person is the lead. Then the phone gets picked up.
I open by pretending we have just landed an enormous deal, then own up. The deal is the lag measure. The only thing I control today is the handful of activities that get me there.
A field engineer chasing the most callouts in a day will quietly wreck your first-time-fix rate: do loads and rush them, or do fewer and do them properly. Pick two or three that conflict, so neither can be gamed. That is half your dashboard.
One owner would not recognise a sale until the money had landed, so his team had nothing to chase this week. If one order in a hundred later gets credited, that is life.
A child's temperature tells you something is wrong; the Calpol is what brings it down. Your numbers split the same way, and that is the whole idea. Forty-two seconds.
PAT test the toaster (the periodic plug-and-cable safety check) and nothing happens, which is the trouble with lead measures. Skip it and you are watching the building burn, and by then the number only tells you what you lost. Near enough a silent film, and no fire was involved.
Lag is standing on the scales: you are already overweight, it is after the fact. Lead is how fast you walk, and how much of it you do. The whole idea, at walking pace.
Hold the warehouse to an on-time-in-full number that a late supplier is wrecking, and by Friday you have told a room of people their work does not count. Give each team two or three numbers they own. Seven clips on choosing them.
Sales blames business development, business development blames account management, and the red square on the board belongs to nobody. Different jobs need different numbers, each one owned by the team that can move it.
A client wanted gross profit after carriage, which is what is left once the courier has been paid. That cost sat in the courier's own system and turned up once a month as a single invoice, so we built the tables to pull it in and split it across the orders. Some of them were making nothing.
You watch the whole company, every department and every number in it, because that is the job you took. The person doing business development moves three things: calls, emails and meetings. Put those on their screen and leave turnover on yours.
Departments across the top, three to six metrics under each, coloured red, amber or green against target. One glance tells you which part of the business needs you this week. No reading required.
One slice of your customer base is miles more profitable than the rest, and you could not name it in a board meeting. Until you can say do this and get that, you will not put your own money behind your own company. That is what stops you.
OTIF is on time in full: orders that turned up complete, on the day you promised. Hold the warehouse to it when the real problem is a supply chain running late, and you have told them their work does not count. Pick something they can move.
You jump from fixing one problem to the next all week, and by Friday you could not say which of them mattered most. A scorecard shows which part of the business is under stress right now. Fix that one.
The 5pm email with the dashboard sitting in the body of it rather than in an attachment, the screen on the wall, the Monday pack nobody opens. Fifteen clips on what people actually look at, and what they scroll past.
The dashboard goes in the body of the email, not on the end of it as an attachment, so nobody has to open anything. The live leaderboard goes on the wall. Both, every day.
Excel is flexible, so it becomes the default, and then it quietly becomes the ceiling. Most firms stop there because nobody has ever paid for the alternative. Not because Excel is good enough.
The number is in there somewhere, and by the time you have found it the moment has gone. A second saved getting to your data is a decision you would otherwise have missed. That is what the digging costs you.
The excuse is always the same: we cannot report on activity because nobody puts it into the CRM (the system holding your customers and every conversation with them). Put the numbers on a wall board with a monthly bonus worth winning. The recording sorts itself out.
Your team will not log their activity until they can see where they rank against each other. Publish the daily snapshot, put a bonus people actually want on the top spot, and watch what happens to your activity data. No memo required.
The report you download to a spreadsheet tells you what already happened last month. A dashboard on the wall, built to sit five minutes behind the order going on the system, puts your sales team in a ranked race. One describes. The other changes the number.
Print the word red in green ink, ask someone what it says, and they slow right down. Colour a dashboard the same way and you cause the same delay, so keep red for under target, green for hit and amber for close. Nobody has to read the words.
Two managers, two reports, two different numbers, and six months of decisions made on both. Nobody knows who Brian is.
A monthly report moves decisions at month end. Live numbers let you spot the product this customer is not buying while you are still sat in front of them. Month end would have been too late.
It has no clarity, no priority and no story, and a manager about to make a decision needs all three. Fred needs firing and Reena needs retraining: both of those need data behind them. A chart is not a story.
Most dashboards report after the fact, which is why they get looked at once. The ones that get used every day are leaderboards, because they show the lead measures a team can still do something about before the month closes. Nobody needs training to read a league table.
Every department has its own stack of spreadsheets and reports, and none of them tie up with each other. Give each one a single matrix (a table you pivot, filter and drill into yourself) and it answers every report they would have queued up to ask you for. They use it because it is easier.
She had one of the biggest ERPs going and still spent an hour a week pulling reports together by hand. We put the numbers into one matrix. She got her lunch break back.
An owner sat there asking why nobody had spotted his best-selling line falling off a cliff. Reporting he looked at every day would have told him in the first week. He found out months later.
If someone needs a training session before they can read it, you have not built a dashboard. You have built a data trap. Sixteen seconds, and one spoken line.
Replace the ERP (the big system running your orders, stock and invoices) and you can land back where you began on a slightly better platform, with everyone who knew why long gone. Fix the data first. One of these is a bank clerk retyping numbers between two systems on one unsplit screen.
People ring us to say Power BI is not working for them. Usually it is not the tool: it is the five different versions of the sales invoice number sitting behind it. Fix that first.
Set the route to bike, then drive it across London. It will not end well. Numbers nobody has checked behave exactly the same way, so check them before they reach a report rather than after somebody has made a decision on them.
Sitting in a branch, watching someone retype figures from one system into another on a single unsplit screen, for three minutes. The two systems should have talked to each other. Failing that, give her a second screen.
The customer bit of an ERP is usually an afterthought, so your reps type in as little as they can get away with. Move it onto a CRM (software that does nothing but hold customers and what was said to them), wire it back, and the reporting improves because the data does. Not because you bought a better chart.
You start with a list of problems, go through a world of pain, and land back roughly where you began on a slightly better platform, with everyone who knew why it started long gone. That is the usual shape of it.
Point AI at numbers sitting in six disconnected systems and it will read them wrong, faster and with more confidence than a person would. Fix the data model first: all your numbers in one place, agreeing with each other. Then let AI at it.
I had four agents running four different jobs the other day whilst I got on with something else. They do not turn up late, they do not go home early, and you can be as rude as you like.
Nearly every main bank now does open banking, which means your statements can arrive on a feed instead of somebody exporting a spreadsheet on a Friday. Waiting a week is a choice, and it is ridiculous.
Quin and I on the part nobody advertises. AI will invent a setting, or a whole API (the doorway one system uses to talk to another), with complete confidence. Push back hard enough and it will agree it was wrong when it was right. The clip stops mid-sentence; there was no clean ending to cut to.
Every business has a Fred in finance. He built the spreadsheets, he understands them, he is a seriously clever man, and none of it ever gets out to the rest of the business. So not everybody is working towards the same numbers.
Quin, our CTO, on why AI has no idea what is true: it guesses from patterns it has seen before, and a confident guess reads exactly like an answer. Plenty of the AI projects he looks at would finish sooner by doing the job properly.
People buy Oracle or Microsoft expecting one system to sort everything out, and it rarely ends that way. If you are running the business on Excel then yes, you do need something. But a tenth of that budget spent on proper reports often does more.
You never know what is going to hit you next. It is a good deal harder to duck when your numbers are scattered round the company like confetti.
Same idea in fifteen seconds: you cannot react to what you cannot see, and the numbers live in six different systems. It ends on a plug for us, which we have left in.
Systems and IT have to drive net profit, or there is no reason to buy them. We do not put software in for the sake of putting software in. Eleven seconds.
Two clips where we point the camera at what we actually sell: one matrix holding every sales number, and a micro app we built rather than buy another platform. We are the vendor. This is the sales bit.
Office talk about a six-billion market cap, and why a micro app (a small screen built straight onto data you already have) wired into your existing sales order report does the same job. The audio is rough in places; it was not filmed for you.
Sales, invoiced sales, gross margin and the number of support cases, all in one matrix you can cut by customer, customer group, product group or salesperson, in either direction. Nobody has to build you a new report for it.
Offcuts, outtakes and the odd aside. Three of them have no sound at all, the shortest runs for three quarters of a second, and one is a car alarm drowning me out while I try to keep a straight face. They are here because they were filmed, not because they close a sale.
I am naturally chaotic and organise myself in one forced hour a week. We wanted an office manager to fix that, and to find the posts worth a real comment rather than automate the comments. It is a 2025 advert, not evergreen advice.
The office PC cost less than a thousand pounds and opens four SSIS packages (the jobs that shift data between systems) without blinking. The £2,500 laptop next to it grinds to a halt. Price and usefulness are not the same thing.
Sitting with a customer, poking at their business, then turning that into a spec a developer can build from. That is the bit I like. Not the code.
A car alarm, a lost thread and a straight face that did not last. This is the bit that usually gets cut. We left the CUT card on the end.
I talk straight over the interviewer to say we build these things fast because we are good at it, then apologise for talking over him. Fifteen seconds, no point made.
A short piece to camera. The recording has no audio at all, so there is genuinely nothing to hear. Published anyway, because the ruling was every clip.
An offcut from the AI conversation, where Quin starts on what most companies still have not done and then it ends. It opens in black and white and switches to colour halfway through.
Three and a half seconds of silent b-roll (filler footage), mid-sentence in the office chair. Useful to a video editor. Useless to you.
A second and a half of offcut: the moment the process itself gets named as the problem. Then it stops.
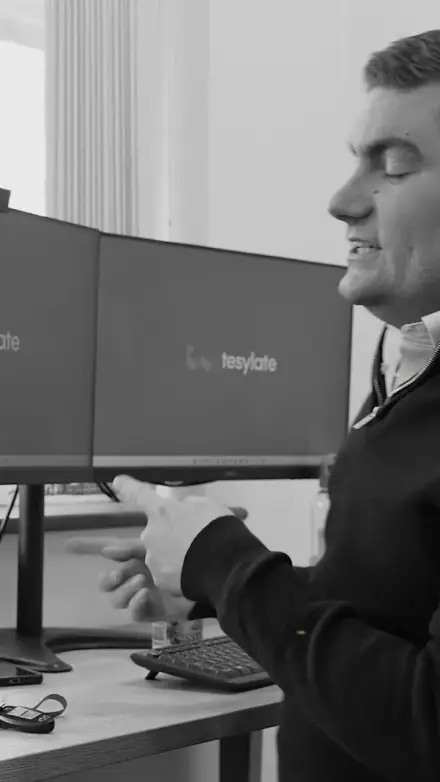
Three quarters of a second of mute b-roll: me at a two-screen desk with an i9 caption on the wall. The shortest thing on the page by some distance.
Nothing matches that. Try another word, or clear the filter.