

DASHBOARDS, WHEREVER WORK HAPPENS

Dashboard KPI reporting.
Everywhere it matters.

Still pulling operational numbers together by hand? Publish one validated view wherever decisions happen. Share the numbers teams use to run the day—on the wall, in the app or in the morning inbox.

Book a demo

TV wallboards · Laptops · Phones · Claude · Email · PNG

See it go from prompt to published

FROM A CONVERSATION TO A DASHBOARD

Ask AI for it.
Then put it to work.

Describe the dashboard you need. Tesylate checks the connected measures. Builds the layouts. And publishes and schedules delivery for your team.

Your brief. Your data. Your dashboard.Illustrative workflow
ClaudeTesylate MCP

Earlier: built and checked Sales scoreboard.

Make the morning update automatic.

You

Email a fresh snapshot to our sales team every day at 9am, London time.

Claude

Your scoreboard is built, published and scheduled. A fresh image will go to the sales team every morning at 09:00, Europe/London.

Snapshot delivery scheduled through Tesylate MCP
Using html-dashboard skillSee preview
SALES SCOREBOARDPublished + scheduled
tesylate/ Sales
Updated 09:00

THE NUMBERS THAT MATTER

Sales scoreboard

Month to date
Revenue£412,380+12% vs last year
Orders318+6% vs last year
Gross margin41.2%+1.4 pts vs last year
Revenue against targetRevenue Target
£475k£238k£0
Start of periodToday
Revenue by team
North£168k
South£142k
Central£102k
87% of £475k target
One team. One score.Illustrative data
Desktop + mobile checked

Tomorrow’s update is taken care of

A fresh snapshot, delivered on your schedule

PublishedSales scoreboard
Daily · 09:00Europe/London · Sales team

Example data and conversation. No live actions.

A short example with the data connection, skill and recipients already set up.

Now see the six ways to share it

One dashboard.
Six ways.

01 / 06TV wallboards

Let everyone see the score.

On the sales floor, in despatch, in the boardroom. Put the numbers where the work happens.

Windows · Android TV · browser displays


A dashboard on a large wall-mounted TV in a boardroom
tesylate/ Sales
Updated 09:00

THE NUMBERS THAT MATTER

Sales scoreboard

Month to date
Revenue£412,380+12% vs last year
Orders318+6% vs last year
Gross margin41.2%+1.4 pts vs last year
Revenue against targetRevenue Target
£475k£238k£0
Start of periodToday
Revenue by team
North£168k
South£142k
Central£102k
87% of £475k target
One team. One score.Illustrative data

Illustrative dashboard · example data

02 / 06On your laptop

See the number. Open the detail.

Your dashboard lives in Tesylate. Click a number tile to explore the records behind it.

In the app · interactive reports
● ● ●app.tesylate.com / dashboards / sales
tesylate/ Sales
Updated 09:00

THE NUMBERS THAT MATTER

Sales scoreboard

Revenue against targetRevenue Target
£475k£238k£0
Start of periodToday
Revenue by team
North£168k
South£142k
Central£102k
87% of £475k target
One team. One score.Illustrative data


Try it: change the period or click a number

Illustrative dashboard · example data

03 / 06On your phone

Out of the office. Still in the picture.

The same dashboard, arranged for the screen in your hand. Check the score wherever the day takes you.

Responsive layouts · no pinching to read

Your business.
A little closer.

The layout changes.
The numbers stay familiar.
9:41▮▮▮   ▰
tesylate/ Sales
Updated 09:00

THE NUMBERS THAT MATTER

Sales scoreboard

Month to date
Revenue£412,380+12% vs last year
Orders318+6% vs last year
Gross margin41.2%+1.4 pts vs last year
Revenue against targetRevenue Target
£475k£238k£0
Start of periodToday
Revenue by team
North£168k
South£142k
Central£102k
87% of £475k target
One team. One score.Illustrative data

app.tesylate.com
Made for the
screen you’re on.
Illustrative dashboard · example data

04 / 06In Claude

Keep the answer in the conversation.

Ask Claude for your dashboard. See it right there in the chat, then ask the next question.

Your connected data · in your conversation
ClaudeSales performance
Show me our sales scoreboard for this month.

Here’s your sales scoreboard. Revenue is up 12% on last year.

tesylate/ Sales
Updated 09:00

THE NUMBERS THAT MATTER

Sales scoreboard

Month to date
Revenue£412,380+12% vs last year
Orders318+6% vs last year
Gross margin41.2%+1.4 pts vs last year
Revenue against targetRevenue Target
£475k£238k£0
Start of periodToday
Revenue by team
North£168k
South£142k
Central£102k
87% of £475k target
One team. One score.Illustrative data

You’re at 87% of the monthly target. Want to look at the sales behind that?

Illustrative dashboard · example data

05 / 06In your inbox

The 9am update. Already sent.

A fresh picture of your dashboard, delivered on schedule. Everyone starts with the same score.

Hourly · daily · weekly · monthly
OOutlookSearchAR
Illustrative dashboard · example data

06 / 06In the board pack

Ready for the next meeting.

Download a crisp PNG for a presentation or board pack. Your dashboard, ready to take with you.

1920 × 1080 PNG · captured at a point in time
MONTHLY BOARD PACK01 / SALES PERFORMANCE

A clear picture.
A better conversation.

tesylate/ Sales
Updated 09:00

THE NUMBERS THAT MATTER

Sales scoreboard

Month to date
Revenue£412,380+12% vs last year
Orders318+6% vs last year
Gross margin41.2%+1.4 pts vs last year
Revenue against targetRevenue Target
£475k£238k£0
Start of periodToday
Revenue by team
North£168k
South£142k
Central£102k
87% of £475k target
One team. One score.Illustrative data
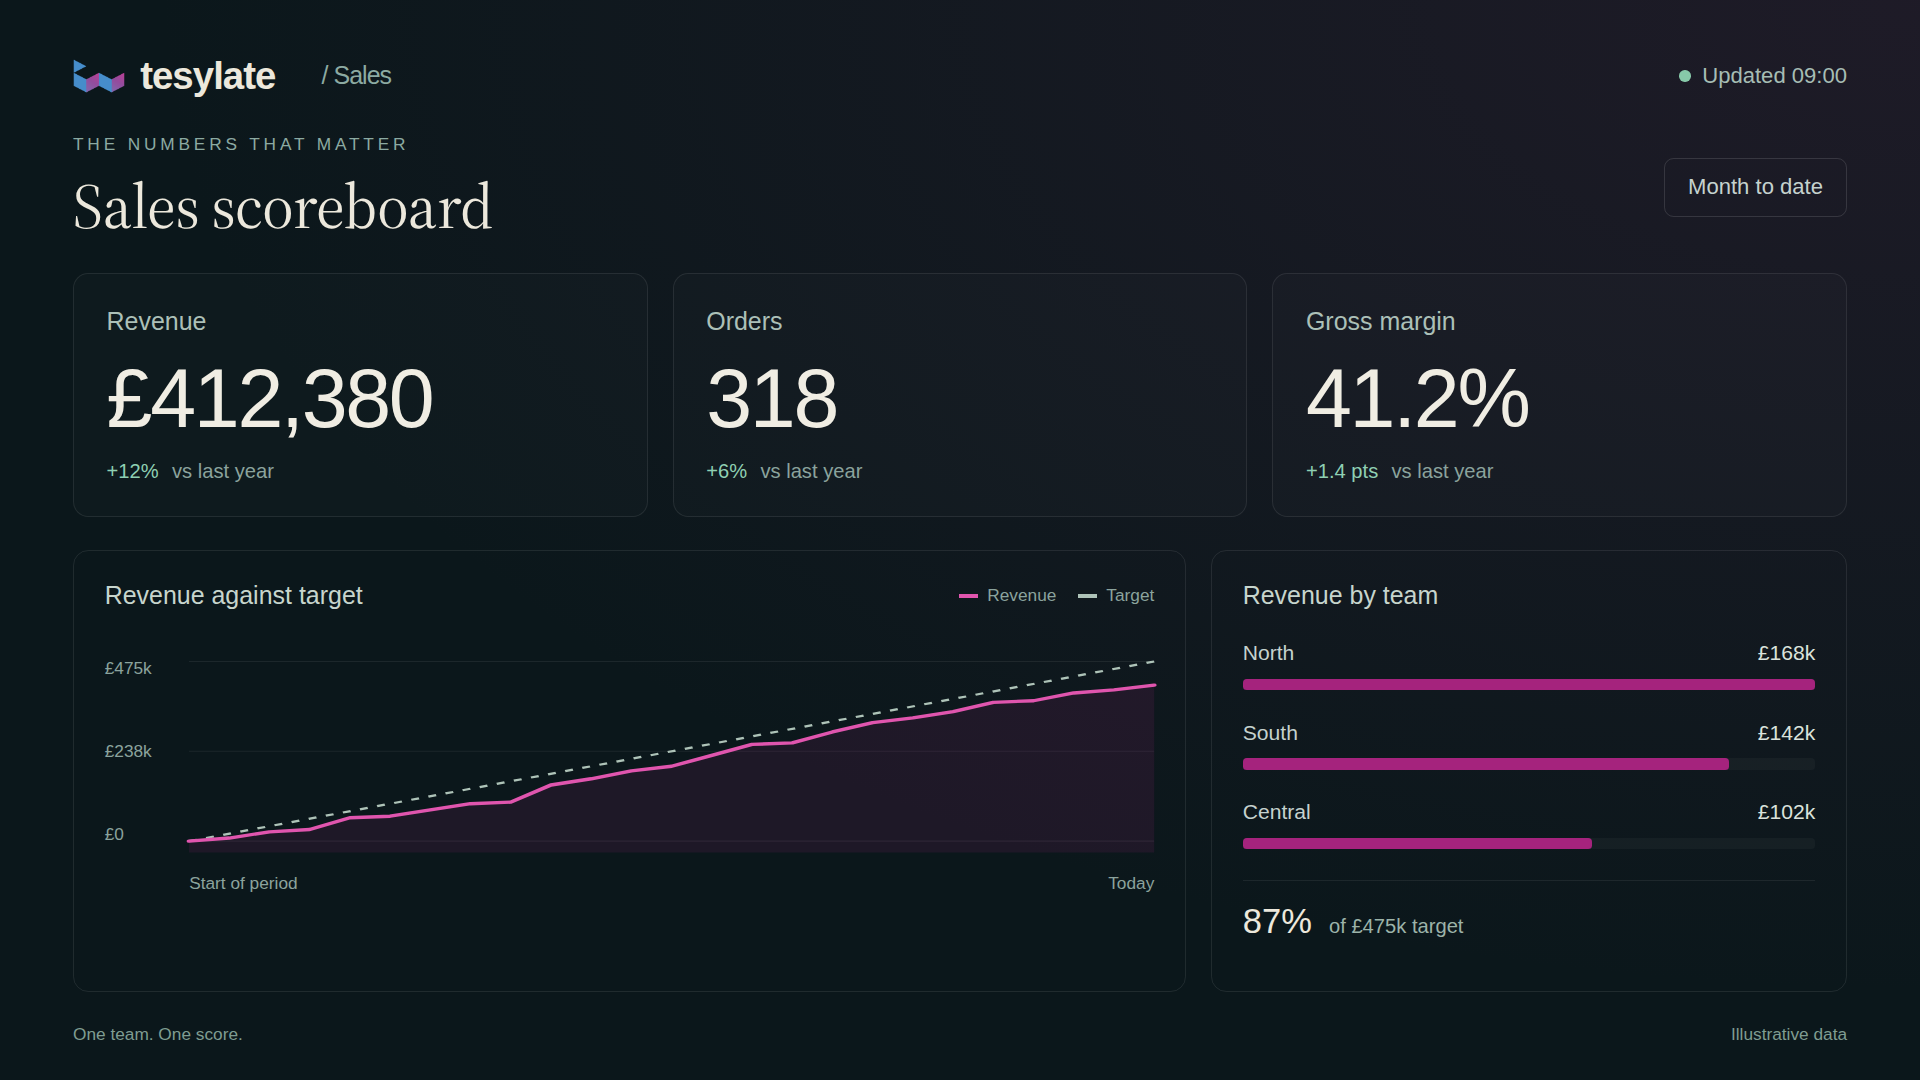
Sales scoreboard · Month to date01
PNGSales scoreboard1920 × 1080 · illustrative example
Illustrative dashboard · example data

BUILT ON THE SAME NUMBERS

Different places.
One version of the score.

Live dashboards follow your connected data’s refresh schedule. Emails and PNGs capture that latest view as they are sent.

How do we start?

Setup starts with your connected data, the measures the team needs and where the dashboard should appear. We confirm the build and support scope for your systems before you commit.

What can I explore in the app?

Number tiles backed by the data model can open the Reporting Matrix with the same filters, so you can follow the total down to its records. Drill-through happens in the app; TV displays, email snapshots and PNGs are for viewing.

How do TV wallboards work?

Use a Windows player, an Android TV / Google TV box or a browser display. Pair a player with its eight-character code and choose its slideshow. The screen uses a signed, expiring address instead of storing your password. Cached boards keep showing during an outage; fresh numbers resume when the connection returns.

The Windows players are on customer walls. The Android TV player is built and tested; it is not yet on a customer wall.

When can snapshots be sent?

Hourly, daily, weekly or monthly. Choose the recipients, the timezone and the days it runs. Each email contains a fresh, branded 1920 × 1080 picture captured when it sends.

Do I need a separate dashboard for my phone?

No. Responsive dashboard layouts rearrange the content for a smaller screen. Your team sees the same measures on the laptop and the phone.

ILLUSTRATIVE DRILL-THROUGH

Reporting Matrix · Revenue

Revenue · MTD · invoiced

In the app, a number opens the records behind it. These are five sample rows from the example report.

InvoiceCustomerRevenue

Illustrative data. Sample rows are not the complete total.

One version of the truth.
Shared.

Bring one set of measures and the screens your team uses. We’ll demonstrate the route from connected data to a checked, scheduled dashboard in 30 minutes.

Book a demo